How to improve popular posts response time?
-
Hi,
Are there any tips on how to improve performance for the popular posts page? The rest of the pages are snappy except for this one and we're trying to figure out why. I've noticed on this forum that it loads pretty quickly and like the other pages as well.
Thanks for any tips!
-
It would look something like this
myPlugin.actionTopicReply = async function (hookData) {
	const userGroups = await Groups.getUserGroupMembership('groups:visible:createtime', [hookData.data.uid]);
	const isInDevGroup = userGroups.flat().includes('My developer group');
	if (isInDevGroup) {
		await topics.setTopicField(hookData.topic.tid, 'postedInByDeveloper', 1);
	}
};
So essentially you save a field into the topic object if a developer posts in it. This way you don't need to calculate it each time the topic list is loaded.
-
I also see this ...
- Topics Indexed: 59384
- Posts Indexed: 567384
I'm trying a couple of things ...
- I'm selecting parent categories to exclude from the index. We have quite a number of unused categories now.
- I'm also clearing index and will reindex after that operation is done.
-
The setting I am talking about is at
/admin/settings/post#recent-settings. The default is 200 and it effects the number of topics returned on/recent,/popularand/top. The indexed topics,posts counts are related to the search plugin and shouldn't have any effect on /popular load times.How many categories do you have? How long does
/api/recenttake vs./api/popularyou can also compare the payload size of both those requests. -
-
Here you go.
{ "db": "nodebb", "collections": 5, "views": 0, "objects": 23784853, "avgObjSize": 113.46550924657807, "dataSize": 2698760458, "storageSize": 1733615616, "indexes": 11, "indexSize": 2583236608, "totalSize": 4316852224, "scaleFactor": 1, "fsUsedSize": 12107075584, "fsTotalSize": 31024283648, "ok": 1, "serverStatusError": "", "mem": { "bits": 64, "resident": "5.557", "virtual": "8.015", "supported": true, "mapped": "NaN" }, "collectionData": [ { "name": "nodebb.sessions", "count": 0, "size": 0, "storageSize": 4096, "totalIndexSize": 8192, "indexSizes": { "_id_": 4096, "expires_1": 4096 } }, { "name": "nodebb.searchtopic", "count": 58315, "size": 4782801, "avgObjSize": 82, "storageSize": 2662400, "totalIndexSize": 5169152, "indexSizes": { "_id_": 638976, "content_text_uid_1_cid_1": 4530176 } }, { "name": "nodebb.socket.io", "count": 3442, "size": 5240037, "avgObjSize": 1522, "storageSize": 573440, "totalIndexSize": 73728, "indexSizes": { "_id_": 73728 } }, { "name": "nodebb.objects", "count": 23173019, "size": 2406545811, "avgObjSize": 103, "storageSize": 1588232192, "totalIndexSize": 1722556416, "indexSizes": { "_id_": 651784192, "_key_1_score_-1": 402395136, "_key_1_value_-1": 508846080, "expireAt_1": 159531008 } }, { "name": "nodebb.searchpost", "count": 550077, "size": 282191809, "avgObjSize": 513, "storageSize": 142143488, "totalIndexSize": 855429120, "indexSizes": { "_id_": 7294976, "content_text_uid_1_cid_1": 848134144 } } ], "network": { "bytesIn": "35.923", "bytesOut": "13.088", "physicalBytesIn": 38559006598, "physicalBytesOut": 14052769242, "numSlowDNSOperations": 0, "numSlowSSLOperations": 0, "numRequests": "10,304,639", "tcpFastOpen": { "kernelSetting": 1, "serverSupported": true, "clientSupported": true, "accepted": 0 }, "compression": { "snappy": { "compressor": { "bytesIn": 0, "bytesOut": 0 }, "decompressor": { "bytesIn": 0, "bytesOut": 0 } }, "zstd": { "compressor": { "bytesIn": 0, "bytesOut": 0 }, "decompressor": { "bytesIn": 0, "bytesOut": 0 } }, "zlib": { "compressor": { "bytesIn": 0, "bytesOut": 0 }, "decompressor": { "bytesIn": 0, "bytesOut": 0 } } }, "serviceExecutors": { "passthrough": { "threadsRunning": 96, "clientsInTotal": 96, "clientsRunning": 96, "clientsWaitingForData": 0 }, "fixed": { "threadsRunning": 1, "clientsInTotal": 0, "clientsRunning": 0, "clientsWaitingForData": 0 } } } } -
It's our low peak right now, but expect it to pick up next month.
To add more context, here's more info ...
1 NodeBB instance with 8 vCPU, 16 GB
1 MongoDB instance with 2 vCPU, 16 GBThe configs are based on the NodeBB documentation.
I'm curious which missteps we did and how we can fine tune. Thanks for your help!
-
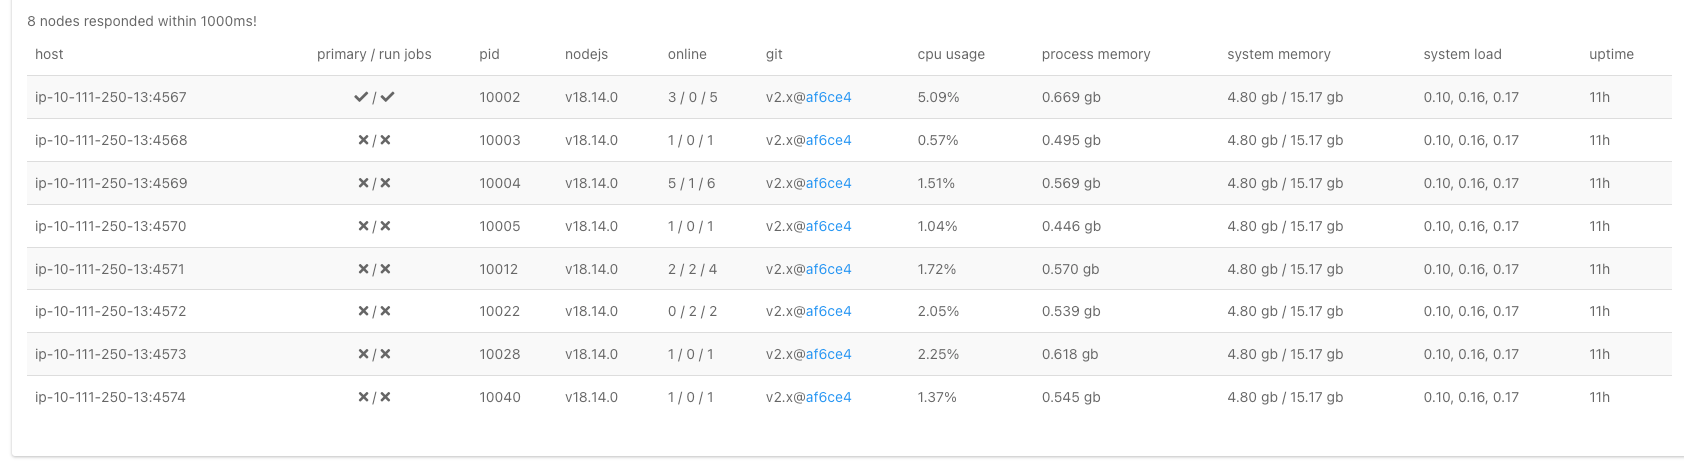
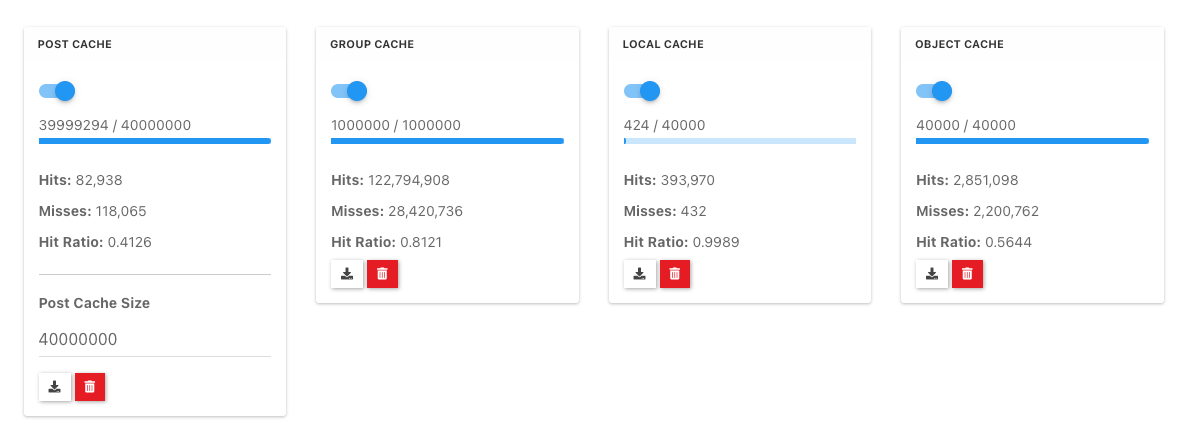
Indices look OK as well. Are you running any custom plugins? Maybe one of them is adding the latency. Your cpu usage and database stats look fine. The object cache hit rate looks low. I remember you mentioned a really low group cache hit rate at https://community.nodebb.org/topic/15398/help-fine-tuning-advanced-cache-settings so wondering if a plugin is causing that as well.
What is the output of
./nodebb pluginsand is your forum public so we can check? -
Here's the output
ubuntu@ip-10-111-250-13:~/nodebb$ ./nodebb plugins
2023-02-23T18:44:33.214Z [4567,4568,4569,4570,4571,4572,4573,4574/11855] - verbose: [minifier] utilizing a maximum of 7 additional threads
Active plugins:
	* [email protected] (installed, enabled)
	* [email protected] (installed, enabled)
	* [email protected] (installed, enabled)
	* [email protected] (installed, enabled)
	* [email protected] (installed, enabled)
	* [email protected] (installed, enabled)
	* [email protected] (installed, enabled)
	* [email protected] (installed, enabled)
	* [email protected] (installed, disabled)
	* [email protected] (installed, enabled)
	* [email protected] (installed, disabled)
	* [email protected] (installed, disabled)
	* [email protected] (installed, disabled)
	* [email protected] (installed, enabled)
	* [email protected] (installed, disabled)
	* [email protected] (installed, enabled)
Yup, it is public. You can access here: https://forums.theshow.com
Thanks!
-
@baris said in How to improve popular posts response time?:
Help Fine Tuning Advanced Cache Settings
Hi, I'm on the advanced cache page and I'm seeing Post Cache, Object Cache, Group Cache and Local Cache are all maxed out. I'm guessing this affects performa...
NodeBB Community (community.nodebb.org)
Yep, I think we solved that by deleting unused groups that we set up. We used to have group specific categories. We did that a couple of years and there's a bunch that we don't need anymore. The hit ratio is pretty decent now.
-
[email protected]does this have any custom code? Or is it just css/html changes to slick theme?https://forums.theshow.com/popular?cid=15is super slow, but if I use a cid that doesn't exist it's super fast.I have a feeling there is some custom code that runs for each topic item to make some external requests or such that slows it down when there are topics to display. Someone would have to debug it by placing some logs into the popular route to figure out where exactly it is spending 5secs.
-
Yes, that is a custom theme based on slick theme.
postedInByDeveloper is something we added to check if a topic has any developer posts.
@Teemberland added that a while ago: https://community.nodebb.org/topic/14867/display-group-badge-on-topic-list/11


")