For the first time the #CoSocialCa Mastodon server has started to struggle just a little bit to keep up with the flow of the Fediverse.
-
-
@[email protected] that's definitely a problem with the sidekiq configuration then. Keeping retries forever just clogs up the queue... I can't imagine they'd be kept forever!
-
@thisismissem @mick where? Are they configurable? And again, how would I know? Is the recommended support channel complaining in mastodon until somebody tells you something that you can’t even verify?
-
Marco Rogersreplied to Marco Rogers on last edited by
@thisismissem @mick all I’m really saying is that even if I wanted to get more knowledgeable and make some decisions about how my server works, I don’t even have the kind of visibility that would facilitate making good decisions.
-
@polotek @mick @thisismissem what happened to the attempt to wire Mastodon up with OpenTelemetry? This kind of thing is what honeycomb.io is really good at exploring
-
@mick @virtuous_sloth If you run multiple sidekiqs, you can have a priority/ordwring of queues. So instead of growing the size of a single sidekiq you can have 2 or 3 smaller ones with the same total threads, but different orders of queues. This allows all of the sidekiqs to work on a temporarily large push or pull queue but makes sure that every queue is getting attention. Just be sure that “scheduler” only appears in one of the multiple sidekiq instances.
Example:

-
@KevinMarks @polotek @mick I think it's still in progress
-
They mention in https://blog.joinmastodon.org/2024/05/trunk-tidbits-april-2024/ that they're trying to get OpenTelemetry into 4.3
-
@polotek @thisismissem I feel this. There’s very little clear documentation that describes how to even go about getting a clear picture of how queues are performing over time.
That’s sorta why I started this thread. A lot of what I’ve figured out about running a server has come from the community of #MastoAdmin figuring it out in public.
-
@KevinMarks @polotek @thisismissem thanks for this, will check it out.
-
@bplein @virtuous_sloth that’s where we’re headed.
Right now trying to ”make number bigger and see what happens.”
-
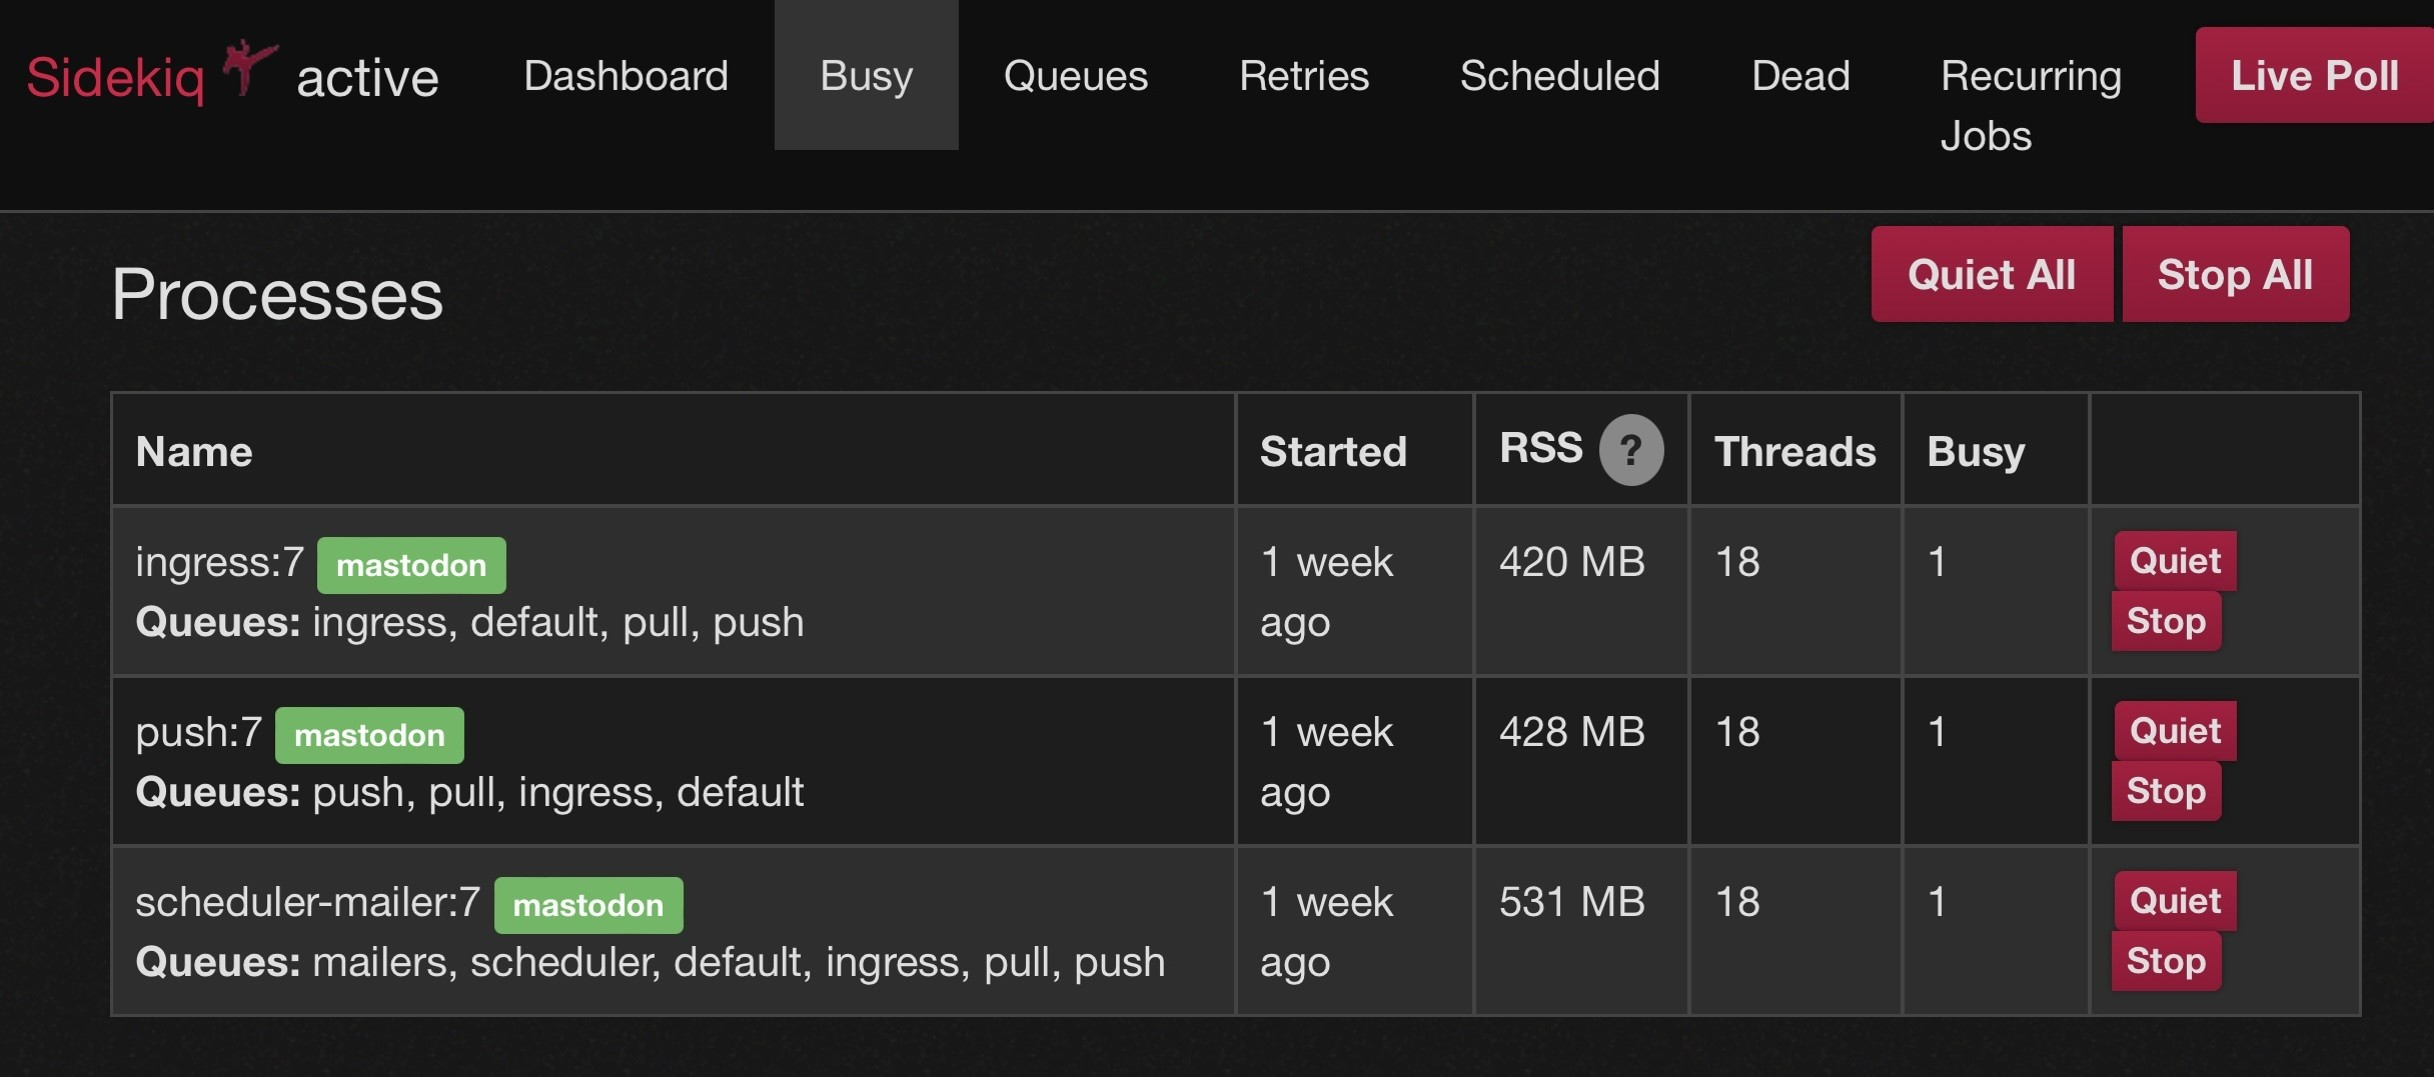
@mick @virtuous_sloth Here are my 3 commands to run it the way I do (I am doing mine from docker-compose but have stripped out that part). Many people have done this using systemd but that’s beyond my ability to help (because: docker)
bundle exec sidekiq -c 18 -q ingress -q default -q pull -q push
bundle exec sidekiq -c 18 -q push -q pull -q ingress -q default
bundle exec sidekiq -c 18 -q mailers -q scheduler -q default -q ingress -q pull -q push -
This looks better! Pull queue never got more than 41 seconds behind and that was only briefly.
I still am not clear on what has contributed to these spikes, so there’s no way of knowing for sure that the changes made yesterday are sufficient to keep our queues clear and up-to-date, but this looks promising.
9/?


-
@mick The much-higher spikes yesterday have an interesting shape to them where it is like there are two or three different load profiles and the latency is switching between them.
I'm not sure if I'm describing that well. You see one shape that rises to a peak of 2.5 minutes then falls and over top that there is a second shape that rides on top and peaks at 4.5 minutes, the there inls a narrower peak that rides on top of the previous and peaks at 7 minutes.
*weird*
-
@virtuous_sloth @mick looks, to my eye, that one peak is ~double the other. Could there be an effect where, at each read point, it either had to run through the list of all xxx, or it had to process the list twice?
-
@virtuous_sloth I see this as well and I’m not totally sure what to make of it. I suspect it’s something to do with the way that the monitoring or graphing is calculating values.
The scrape interval is 15 seconds, so it doesn’t make sense for the latency to be bouncing around so much, and in such suspiciously well-defined bands.
This banding has only shown up in relation to these recent spikes.

-
@rndeon @virtuous_sloth That’s an interesting idea. It looks like within the space of 15s it decides that the latency is twice or half as bad as it was 15s prior. Could be because of some sort of duplication as you suggest.
-
@mick @virtuous_sloth i don't know enough about what's being plotted to have insight, but I'm curious! Is the y axis the time a particular task spent in the queue? And over 15s, it averages over all tasks that left the queue to make a data point?
-
Well, we’re not out of the woods yet.
We fell behind by less than a minute for most of the day yesterday, with some brief periods where we were slower still.
The droplet is showing no signs of stress with the increased Sidekiq threads, so I can toss a bit more hardware at the problem and see if we can reach equilibrium again.
Better would be to get a clearer picture of what’s going on here.
Maybe we need to do both of these things!
10/?


-
@rndeon @virtuous_sloth The sidekiq stats here are coming from this Prometheus exporter: https://github.com/Strech/sidekiq-prometheus-exporter
The graph is showing the “sidekiq_queue_latency_seconds” gauge, which is “The number of seconds between the oldest job being pushed to the queue and the current time.”
Prometheus is configured to scrape the data from the exporter every 15 seconds, and Grafana is sampling on a 15s interval as well.


