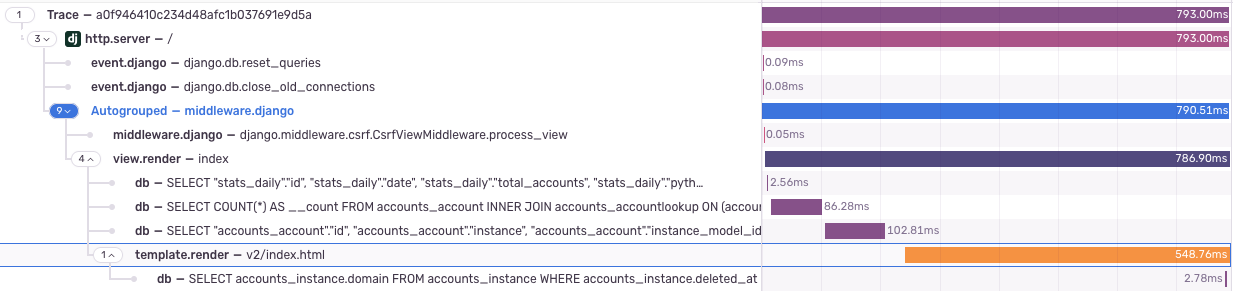
First time that I see template rendering being a bit of a bottle neck in a Django app.
-
Anže :python:replied to Carlton Gibson 🇪🇺 last edited by
@carlton There is one 2.7ms db query that gets run during template rendering. The other three queries are run before the rendering starts and are also below 200ms, so I'm pretty sure the template rendering took the longest at around 500ms.
The raspberry pi doesn't have the fastest CPU so this might not be an issue on a regular host.
-
Carlton Gibson 🇪🇺replied to Anže :python: last edited by
@anze3db interesting. It would be fun to dig into what’s taking the time there. Template rendering is ALWAYS the second slowest bit… 🧐
-
Carlton Gibson 🇪🇺replied to Carlton Gibson 🇪🇺 last edited by
-
Anže :python:replied to Carlton Gibson 🇪🇺 last edited by
@carlton the SD card that I'm using is too slow for this disk caching to be viable

-
Carlton Gibson 🇪🇺replied to Anže :python: last edited by
@anze3db ah… yes… the limits of an RPi become clear.
-
Anže :python:replied to Carlton Gibson 🇪🇺 last edited by
@carlton the SD card issue was my own blunder. I am using an SD card that can only read up to 4mb/, but I could have easily gotten one that goes up to 100mb/s
Also, this was the only trace that I have out of 100k requests from yesterday that was over 400ms long.
-
Carlton Gibson 🇪🇺replied to Anže :python: last edited by
@anze3db that last point can be telling. Maybe the RPi is just doing something else when that request comes in…

-
Anže :python:replied to Carlton Gibson 🇪🇺 last edited by
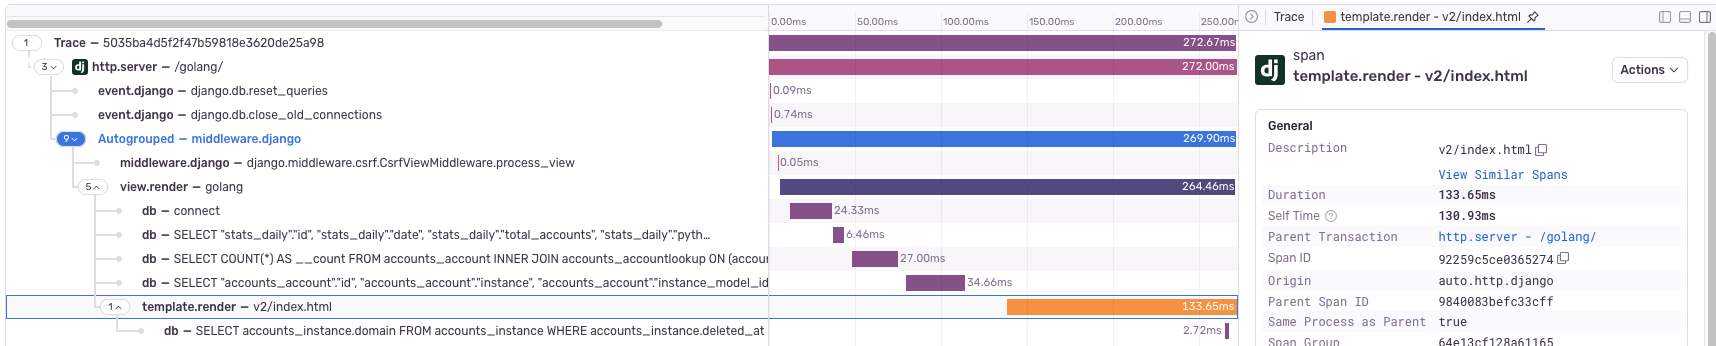
@carlton yeah, could be, but I'm now digging into this and it looks like template rendering is taking the longest even in some faster requests. I'll see if I can figure out what could be causing this.
-
-
Carlton Gibson 🇪🇺replied to Gasper Zejn last edited by
Most of the performance difference there is in the parsing phase, which is moot since the cached template loader is used in recent versions.
The DTL may be marginally slower to render, but not such that you'd expect template rendering to dominate. There must be some particular reason this is taking an age.
Aside: over the years I've done web apps is Every Language With Every Framework
 . Template rendering is ALWAYS 2nd slowest. There's more to tell here. Seguro.
 -
Anže :python:replied to Carlton Gibson 🇪🇺 last edited by
@carlton @hruske Hm... l managed to shave of 100ms of rendering time by inlining an inclusion tag, that I was using inside a for loop.
I'll report back if this change also translates in a similar improvement in prod where the cached template loader is used.
The commit diff is here if you are curious: https://github.com/anze3db/fedidevs/commit/7bf9870d8ab42924ea4b23a292af3ecf0177dc9b
-
@carlton @hruske I'm circling back to this post because I now have data from production. There was *no* performance increase due to me inlining the template import inside the for loop.
The perf boost that I was seeing locally was only due to the fact that I had DEBUG=True which prevented the use of the cached template loader. I apologize for the confusion!
-
Carlton Gibson 🇪🇺replied to Anže :python: last edited by
@anze3db @hruske Good! I wanted to query you on that: You don't use the cached loader in development?
After parsing, a template is just a node list, stored in-memory, so the loader literally just does a lookup for it, so include shouldn't be slow, not really. (Like nano-whatsits for a couple of stack frames is about all)
-
Anže :python:replied to Carlton Gibson 🇪🇺 last edited by
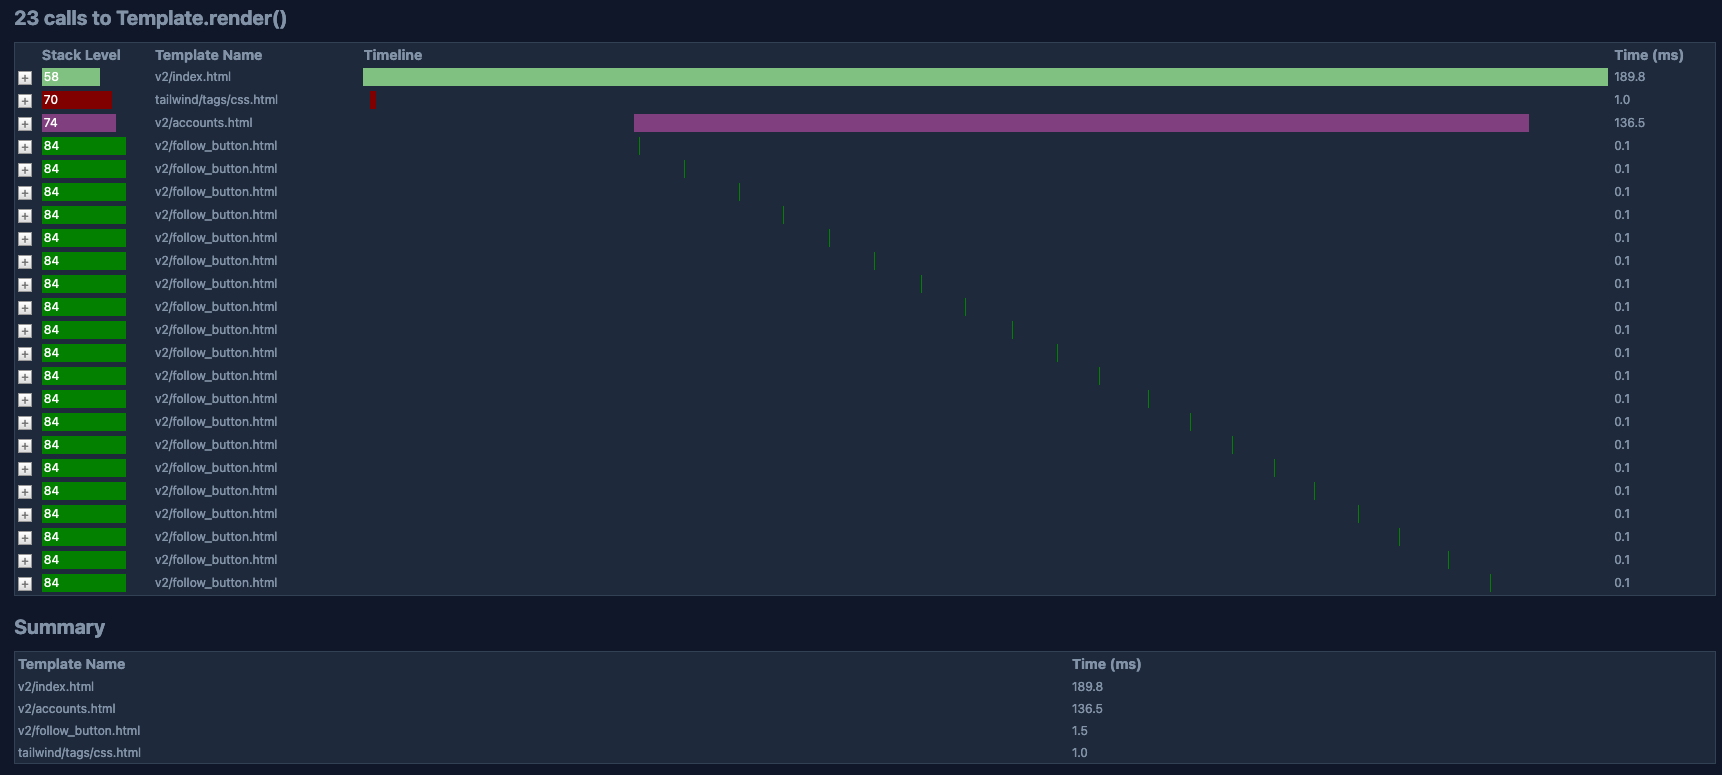
@carlton @hruske I think I found the culprit for this.
`django-debug-toolbar-template-profiler` adds some overhead on every template include. So the differences that I've been seeing between inline and include was due to this overhead.
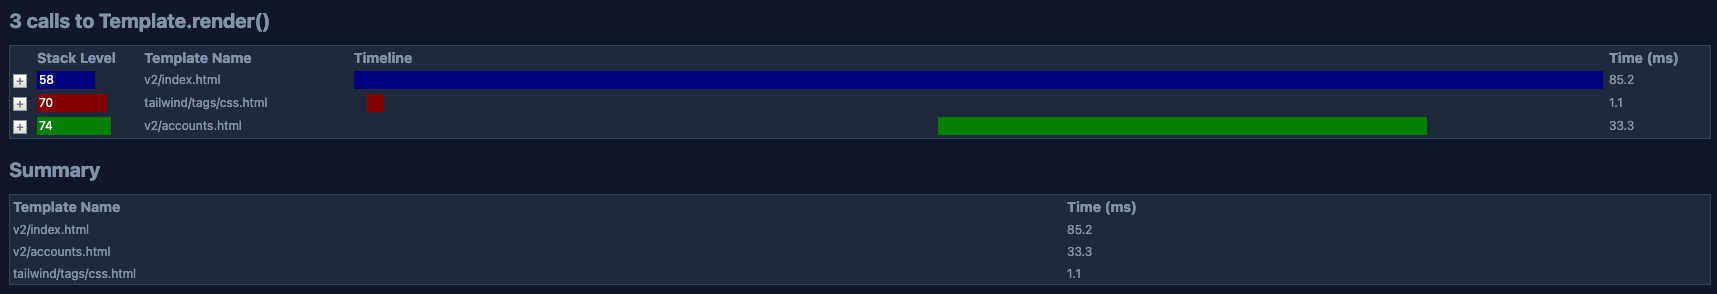
If I have template profiling enabled the include version is 2x slower (700ms vs 1.4s), if I disable profiling they are both almost the same (10ms give or take)
Annoying when the tool you are using to measure impacts the measurement
-
Marijke Luttekesreplied to Anže :python: last edited by [email protected]
